
Top 15 Server Performance Monitoring Tools Every SysAdmin Should Know
Monitoring server performance is one of the most important responsibilities of every system administrator. Whether you're managing a single Linux server, multiple Linux VPS instances, continuous monitoring helps identify performance bottlenecks, and ensure applications run efficiently.
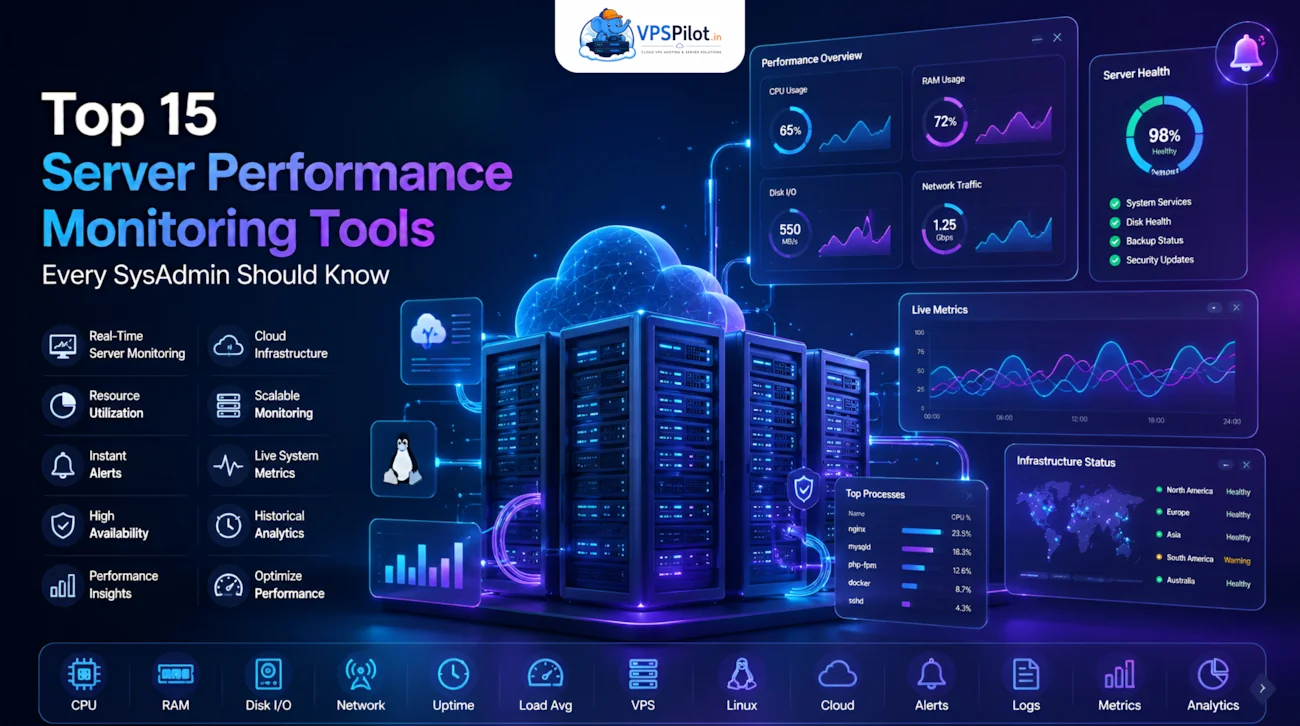
Monitoring server performance is one of the most important responsibilities of every system administrator. Whether you’re managing a single Linux server, multiple Linux VPS instances, or an enterprise infrastructure, continuous monitoring helps identify performance bottlenecks, prevent downtime, and ensure applications run efficiently.
Modern servers host websites, databases, APIs, cloud applications, and business-critical workloads that require consistent performance. Without proper monitoring, issues such as high CPU usage, excessive memory consumption, disk bottlenecks, or network congestion can go unnoticed until they begin affecting users. By using the right monitoring tools, administrators can detect problems early, troubleshoot resource-intensive processes, and maintain optimal server health.
In this guide, Top 15 Server Performance Monitoring Tools Every SysAdmin Should Know, we’ll explore some of the most reliable monitoring solutions used by Linux administrators to track system performance, optimize resource utilization, and improve overall server reliability.
Why Server Performance Monitoring Is Important
Performance monitoring provides real-time visibility into server health and helps administrators make informed decisions before small issues become major outages.
Key benefits include:
- Detect CPU and memory bottlenecks
- Monitor disk and network performance
- Improve application availability
- Reduce unexpected downtime
- Optimize server resources
- Troubleshoot performance issues quickly
- Plan infrastructure upgrades based on actual usage
- Improve overall system reliability
Whether you’re running a small business website or managing production workloads on a Virtual Private Server, monitoring should be part of your regular maintenance routine.
Key Metrics Every SysAdmin Should Monitor
Before choosing a monitoring tool, it’s important to understand the metrics that directly affect server performance.
Some of the most critical metrics include:
- CPU utilization
- Memory (RAM) usage
- Swap usage
- Disk I/O
- Storage capacity
- Network bandwidth
- Load average
- Active processes
- Running services
- System uptime
- Database performance
- Web server response time
Monitoring these metrics helps identify resource bottlenecks before they impact application performance.
1. htop
Best For: Real-time process monitoring
htop is one of the most popular command-line monitoring tools for Linux. It provides a colorful, interactive interface that makes it easy to monitor CPU usage, memory consumption, swap utilization, and running processes.
Features
- Interactive process management
- CPU and RAM monitoring
- Process search and filtering
- User-friendly interface
- Tree view of running processes
Installation
Ubuntu/Debian:
sudo apt install htop
Run:
htop
For many Linux administrators, htop is the first tool used when troubleshooting high resource usage.
2. Glances
Best For: Comprehensive server monitoring from a single dashboard
Glances is an all-in-one monitoring tool that provides detailed insights into system performance.
It displays:
- CPU usage
- Memory usage
- Disk utilization
- Network activity
- Running processes
- Filesystem statistics
- Docker container information
Advantages
- Lightweight
- Easy to install
- Supports web mode
- Cross-platform
- Color-coded interface
Glances is ideal for administrators who want a complete overview without switching between multiple tools.
3. Netdata
Best For: Real-time monitoring dashboards
Netdata offers a modern web-based interface with hundreds of built-in performance charts.
It monitors:
- CPU
- RAM
- Disk I/O
- Network traffic
- Apache
- Nginx
- MySQL
- Docker
- Kubernetes
Benefits
- Automatic dashboards
- Minimal configuration
- Real-time alerts
- Low resource usage
- Easy installation
Netdata is an excellent choice for administrators who prefer visual performance analytics.
4. Prometheus
Best For: Large-scale infrastructure monitoring
Prometheus is one of the most widely used open-source monitoring systems for cloud-native environments.
It collects time-series metrics from applications and servers.
Features
- Powerful query language (PromQL)
- Time-series database
- Alert manager integration
- Kubernetes support
- Flexible exporters
Prometheus is widely used in DevOps environments for monitoring Linux servers, containers, and cloud infrastructure.
5. Grafana
Best For: Data visualization
Grafana is not a monitoring tool by itself but a visualization platform that integrates with Prometheus, InfluxDB, MySQL, and many other data sources.
Key Features
- Interactive dashboards
- Real-time charts
- Alerting
- Multiple data source support
- Custom dashboards
Grafana enables administrators to create visually rich dashboards for tracking server performance over time.
6. Zabbix
Best For: Enterprise server monitoring
Zabbix is a feature-rich monitoring platform suitable for medium and large infrastructures.
It supports:
- Linux servers
- Windows servers
- Network devices
- Databases
- Cloud services
- Virtual machines
Benefits
- Agent-based monitoring
- Agentless monitoring
- Automatic discovery
- Email alerts
- Historical reporting
Zabbix is well-suited for organizations managing hundreds or thousands of systems.
7. Nagios
Best For: Infrastructure monitoring
Nagios has been a trusted monitoring solution for many years.
It monitors:
- Servers
- Services
- Network devices
- Applications
- Databases
Advantages
- Large plugin ecosystem
- Reliable alerting
- Service monitoring
- Custom monitoring scripts
- Extensive community support
Nagios remains a dependable choice for organizations with established monitoring workflows.
8. atop
Best For: Historical performance analysis
Unlike many monitoring tools that display only current system activity, atop records historical performance data for later analysis.
It tracks:
- CPU usage
- Memory usage
- Disk activity
- Network traffic
- Process history
Why Use atop?
Historical data helps administrators investigate issues that occurred in the past, making it valuable for diagnosing intermittent performance problems.
Best Practices for Effective Server Monitoring
To get the most value from your monitoring tools:
- Monitor servers continuously rather than only during incidents.
- Set alert thresholds for CPU, memory, disk usage, and network activity.
- Review performance trends regularly to identify potential bottlenecks.
- Keep monitoring software updated to benefit from new features and security improvements.
- Combine command-line tools with dashboard-based solutions for comprehensive visibility.
9. vmstat
Best For: Monitoring system performance and virtual memory
vmstat (Virtual Memory Statistics) is a built-in Linux command-line utility that provides valuable insights into CPU activity, memory usage, processes, swap utilization, and disk I/O. It is particularly useful for identifying performance bottlenecks caused by insufficient memory or excessive swapping.
Features
- CPU utilization
- Virtual memory statistics
- Swap activity
- Process monitoring
- Disk I/O analysis
Example
vmstat 5
This command refreshes system statistics every five seconds, allowing administrators to monitor performance in real time.
10. iostat
Best For: Disk and storage performance monitoring
The iostat utility, included in the sysstat package, helps administrators analyze CPU utilization and storage device performance. High disk latency often affects database servers and high-traffic websites, making this tool essential for troubleshooting storage-related issues.
Features
- Disk read/write statistics
- CPU utilization
- Device throughput
- I/O wait analysis
Installation
sudo apt install sysstat
Example
iostat -xz 2
This command displays extended disk statistics every two seconds.
11. dstat
Best For: Combined system resource monitoring
dstat combines the functionality of several Linux monitoring commands into a single interface. Instead of running separate tools for CPU, memory, network, and disk activity, administrators can monitor everything simultaneously.
Features
- CPU monitoring
- Memory statistics
- Disk I/O
- Network traffic
- Process activity
Example
dstat
Its simple and comprehensive output makes it an excellent choice for quick performance analysis.
12. Collectd
Best For: Long-term performance data collection
Collectd is a lightweight daemon designed to collect and store performance metrics from Linux servers. It supports hundreds of plugins and integrates seamlessly with monitoring platforms such as Grafana and InfluxDB.
Features
- Lightweight resource usage
- Plugin-based architecture
- Historical performance metrics
- Easy integration with visualization tools
Collectd is ideal for administrators who want long-term monitoring with minimal system overhead.
13. Cacti
Best For: Network and infrastructure graphing
Cacti is an open-source monitoring solution that specializes in creating detailed performance graphs using SNMP and RRDtool.
Features
- Historical performance charts
- Network monitoring
- Bandwidth analysis
- Device monitoring
- Scheduled polling
Cacti is especially useful for organizations managing routers, switches, and multiple servers.
14. Datadog
Best For: Cloud infrastructure monitoring
Datadog is a cloud-based monitoring platform that provides complete visibility into applications, servers, containers, databases, and cloud services.
Features
- Infrastructure monitoring
- Application performance monitoring (APM)
- Log management
- Security monitoring
- Real-time alerts
- Cloud integrations
Datadog is widely used by DevOps teams managing hybrid and cloud-native environments.
15. New Relic
Best For: Application and server performance monitoring
New Relic offers end-to-end observability for applications and infrastructure. It helps administrators identify performance bottlenecks across servers, databases, APIs, and cloud services.
Features
- Real-time monitoring
- Application performance insights
- Database monitoring
- Distributed tracing
- Error analytics
- Infrastructure dashboards
New Relic is particularly valuable for organizations running business-critical web applications.
Comparison of Popular Server Monitoring Tools
| Tool | Best For | Interface | Suitable For |
|---|---|---|---|
| htop | Process monitoring | CLI | Linux Servers |
| Glances | System overview | CLI/Web | Small & Medium Servers |
| Netdata | Real-time dashboards | Web | VPS & Cloud Servers |
| Prometheus | Metrics collection | Web | DevOps & Kubernetes |
| Grafana | Visualization | Web | Dashboards & Analytics |
| Zabbix | Enterprise monitoring | Web | Large Infrastructure |
| Nagios | Infrastructure monitoring | Web | Production Servers |
| atop | Historical analysis | CLI | Linux Performance |
| vmstat | Memory & CPU | CLI | Linux Administration |
| iostat | Disk monitoring | CLI | Storage Performance |
| dstat | Combined monitoring | CLI | Resource Analysis |
| Collectd | Metric collection | CLI | Long-term Monitoring |
| Cacti | Performance graphs | Web | Network Monitoring |
| Datadog | Cloud monitoring | Web | Enterprise Cloud |
| New Relic | Application monitoring | Web | Web Applications |
How to Choose the Right Monitoring Tool
The best monitoring tool depends on your infrastructure and operational requirements.
- For quick command-line diagnostics: htop, vmstat, iostat, and dstat.
- For real-time dashboards: Netdata and Grafana.
- For enterprise environments: Zabbix and Nagios.
- For cloud-native infrastructure: Prometheus combined with Grafana.
- For SaaS monitoring: Datadog and New Relic.
- For historical performance analysis: atop and Collectd.
Many organizations use multiple tools together to achieve comprehensive visibility across their infrastructure.
Best Practices for Server Performance Monitoring
To maintain a healthy and reliable Linux server environment:
- Monitor CPU, RAM, disk, and network usage continuously.
- Configure alerts for abnormal resource utilization.
- Review historical performance trends regularly.
- Keep monitoring tools updated.
- Monitor application performance alongside server metrics.
- Automate reporting for proactive maintenance.
- Test alerting mechanisms periodically.
- Document performance baselines for future comparisons.
A proactive monitoring strategy helps prevent downtime and ensures consistent application performance.
Hostzop: Build a High-Performance Monitoring Environment
Effective monitoring begins with reliable infrastructure. Hostzop offers powerful Linux VPS Hosting designed for developers, businesses, and system administrators who require speed, stability, and complete control over their servers.
Whether you’re deploying monitoring platforms like Prometheus, Grafana, Zabbix, or Netdata, Hostzop provides dedicated resources, full root access, scalable VPS plans, and enterprise-grade reliability to support demanding workloads. By implementing the solutions covered in Top 15 Server Performance Monitoring Tools Every SysAdmin Should Know, combined with a high-performance Hostzop Linux VPS, you can detect performance bottlenecks early, optimize server resources, reduce downtime, and maintain a secure, efficient, and highly available hosting environment.
Frequently Asked Questions
Which server monitoring tool is best for beginners?
For beginners, htop, Glances, and Netdata are excellent choices because they are easy to install, provide clear performance metrics, and require minimal configuration.
What metrics should I monitor on a Linux server?
Every Linux administrator should monitor CPU utilization, memory usage, swap activity, disk I/O, storage capacity, network traffic, load average, active processes, and system uptime.
Is Grafana a monitoring tool?
Grafana is primarily a visualization platform. It displays metrics collected by tools such as Prometheus, InfluxDB, or Collectd through interactive dashboards.
Can I use multiple monitoring tools together?
Yes. Many organizations combine tools such as Prometheus + Grafana, Netdata + Grafana, or Zabbix + Grafana to achieve comprehensive monitoring and visualization.
Why is continuous server monitoring important?
Continuous monitoring helps identify performance issues before they impact users. It improves system reliability, reduces downtime, supports capacity planning, and enables administrators to respond quickly to unexpected resource spikes.
Conclusion
Server performance monitoring is an essential practice for maintaining fast, stable, and reliable Linux infrastructure. By tracking key metrics such as CPU usage, memory consumption, disk performance, network activity, and application health, system administrators can identify potential issues before they become critical. Whether you manage a single Linux VPS or a large-scale enterprise environment, choosing the right monitoring tools can significantly improve operational efficiency and system reliability.
The tools covered in Top 15 Server Performance Monitoring Tools Every SysAdmin Should Know provide a wide range of capabilities—from lightweight command-line utilities like htop and vmstat to enterprise-grade platforms such as Prometheus, Grafana, Zabbix, Datadog, and New Relic. By selecting the tools that best match your infrastructure and implementing a proactive monitoring strategy, you can reduce downtime, optimize resource utilization, and ensure your servers continue to perform at their best as your applications and business grow.